FBref is an extensive data base of historical football statistics. It includes all major leagues, clubs and both national and international competitions.
Sometimes it's difficult to make sense of all the data. So I wrote a minimal dashboard in Python with Plotly to help compare the performance of players from the men's big five European leagues.
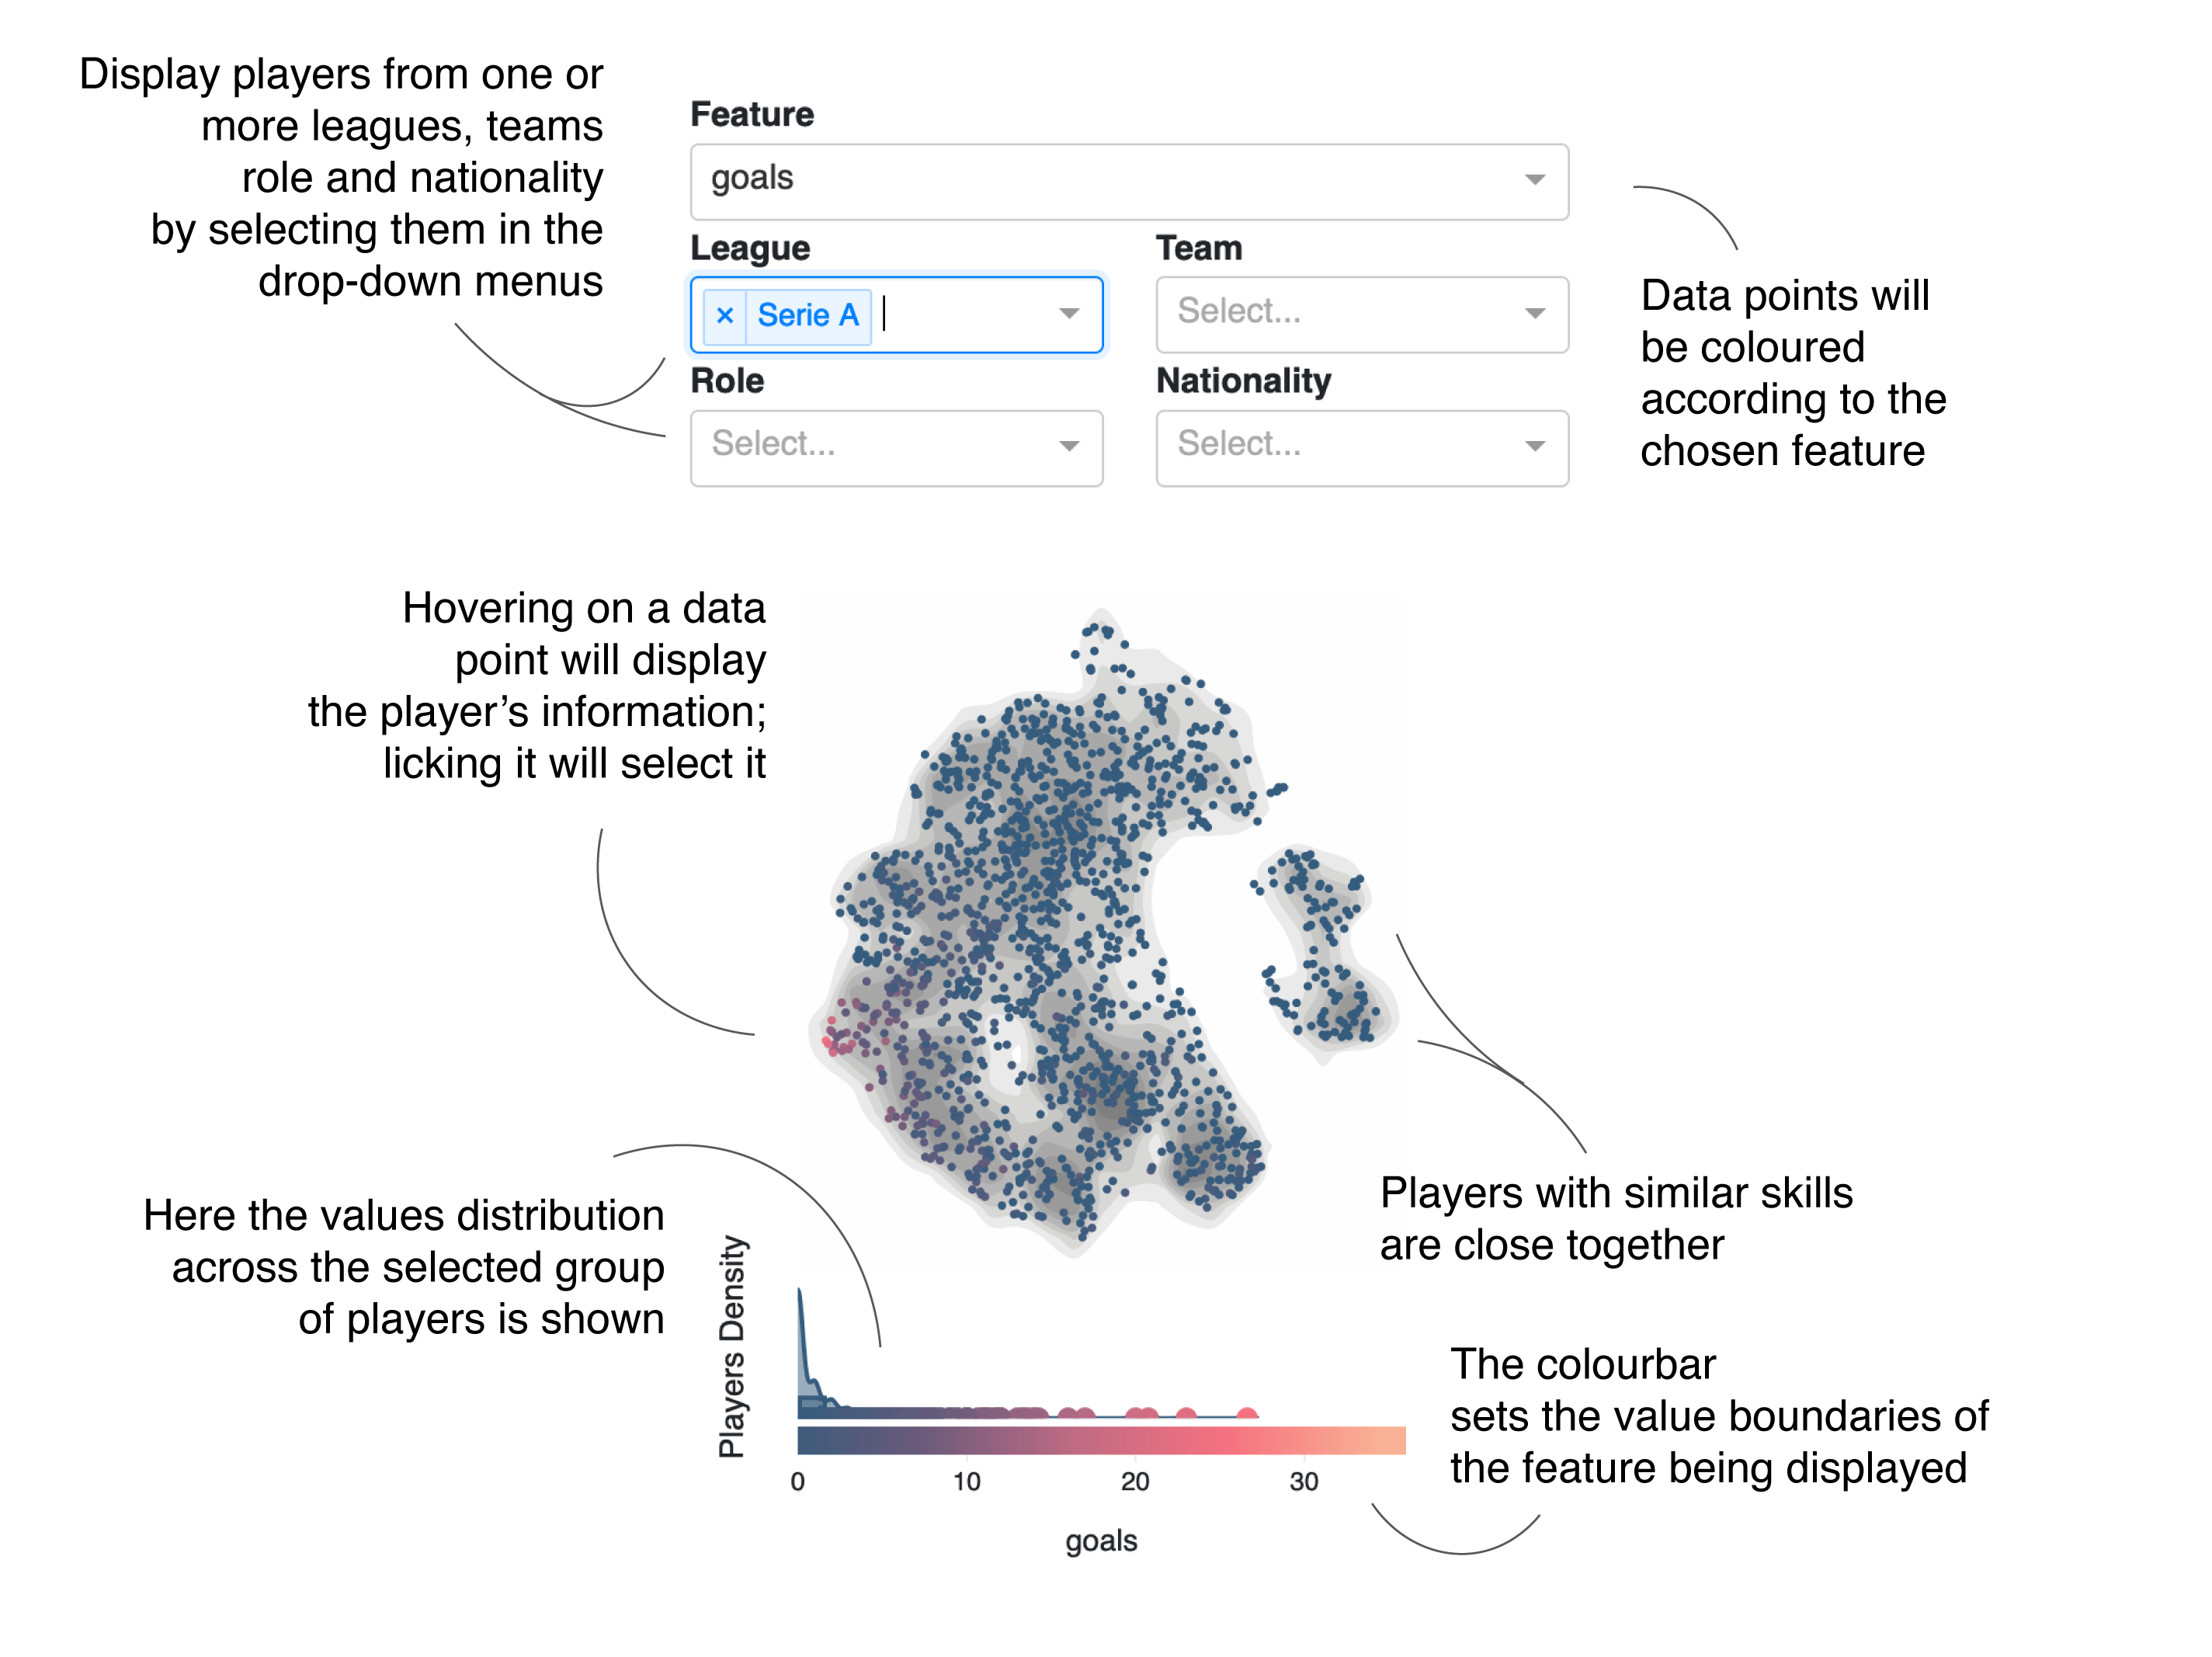
The dashboard is divided into two sections. On the left, a low-dimensionality projection can help you identify players that have similar skills. The scatter plot can be coloured by the value of several features (e.g. goals, passes, saves, ...), below is the distribution of values within the selected group and the matching the colour bar.
Points in the scatterplot can be subset through the dropdown menu above, by season (2017 to 2022, or the average of all seasons), league, team, role or nationality. Except for the season, all other categories are additive, and multiple values can be selected.
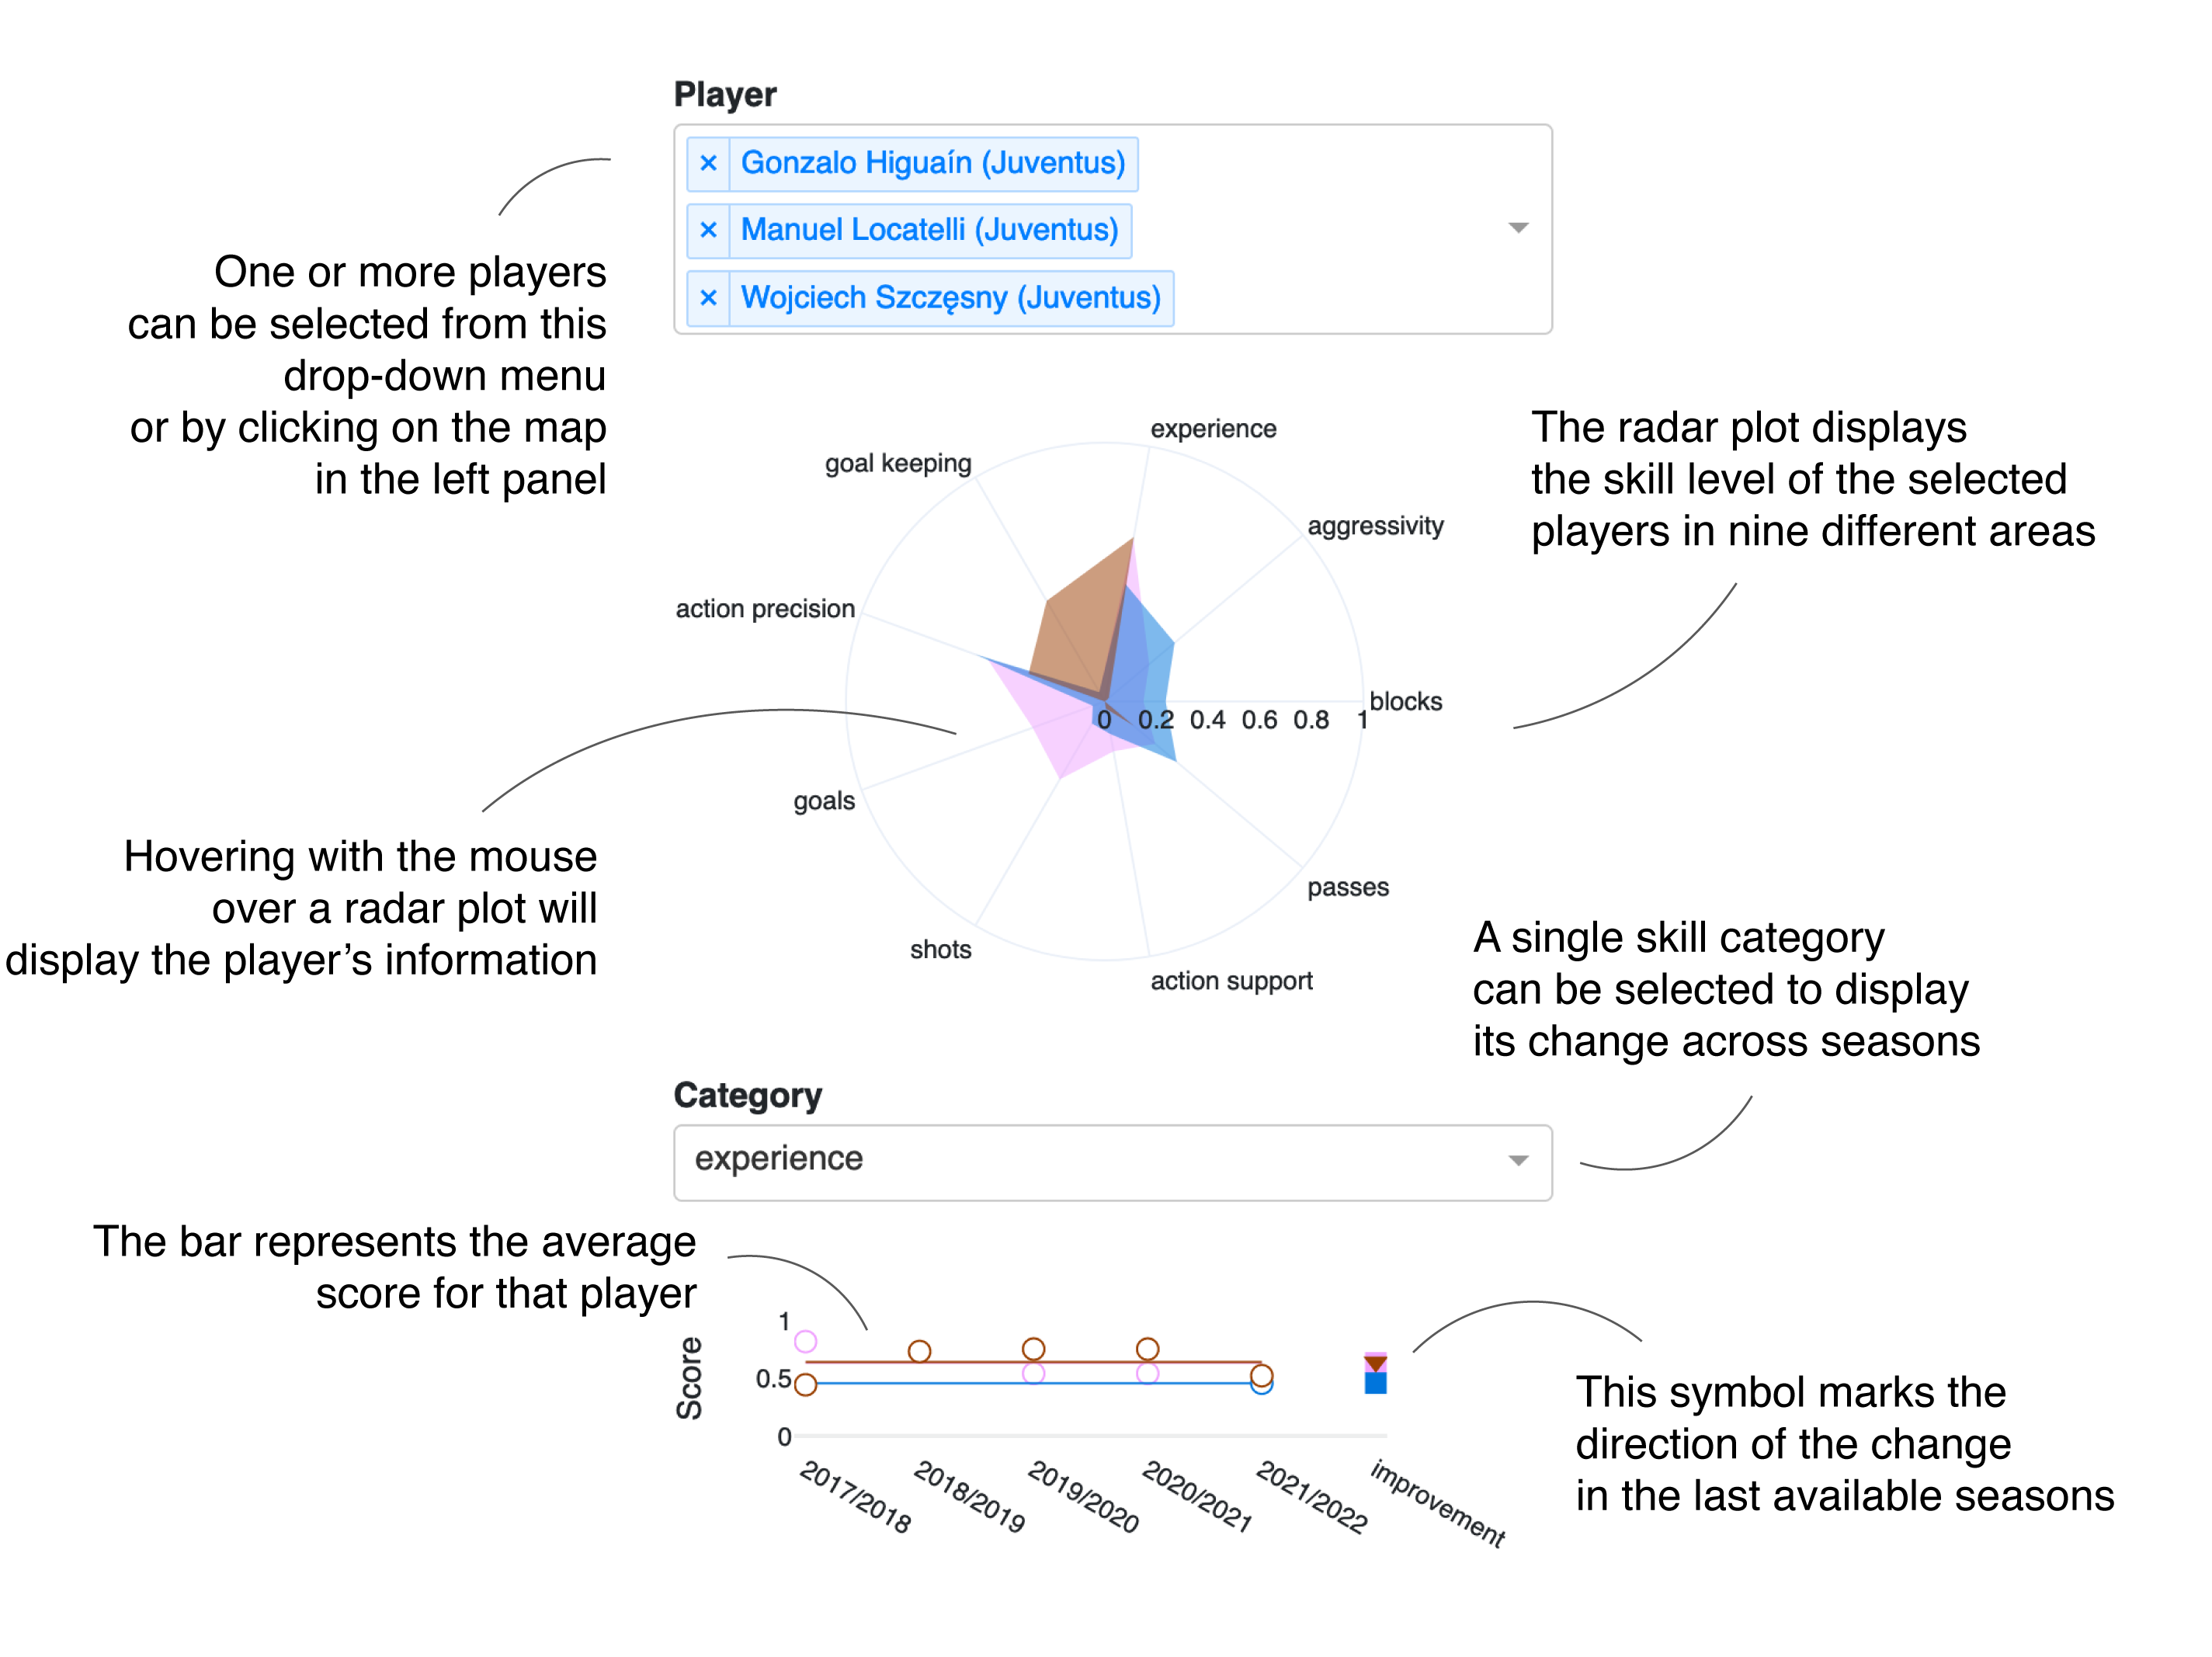
 On the right, a radar plot can display the skills of a single player, selected with the drop-down menu at the top.
These are grouped into 9 major labels: their experience, aggressivity, blocking capabilities, passes, support to actions forward, shots made, goals, precision in actions forward(such as how many goals per shot are made) and goalkeeping skills. These values are normalized across the data set.
On the right, a radar plot can display the skills of a single player, selected with the drop-down menu at the top.
These are grouped into 9 major labels: their experience, aggressivity, blocking capabilities, passes, support to actions forward, shots made, goals, precision in actions forward(such as how many goals per shot are made) and goalkeeping skills. These values are normalized across the data set.
Multiple players can be selected and compared. Those who worked on different teams are kept separate, in case their role and their stats
changed.
The bottom plot shows a single skill, to be selected, and how it changed with time for each selected player. The line represents the average and on the right is a marker showing the improvement (if any) through time: upper facing triangle if the player improved in the last years of data available, lower facing triangle if it got worse and a square if they maintained a similar score (within a 5% boundary).
Clicking a data point on the map on the left will summon the matching values of the selected player on the plots to the right.